Dashboards in Python
Advanced dashboards
that compute and act
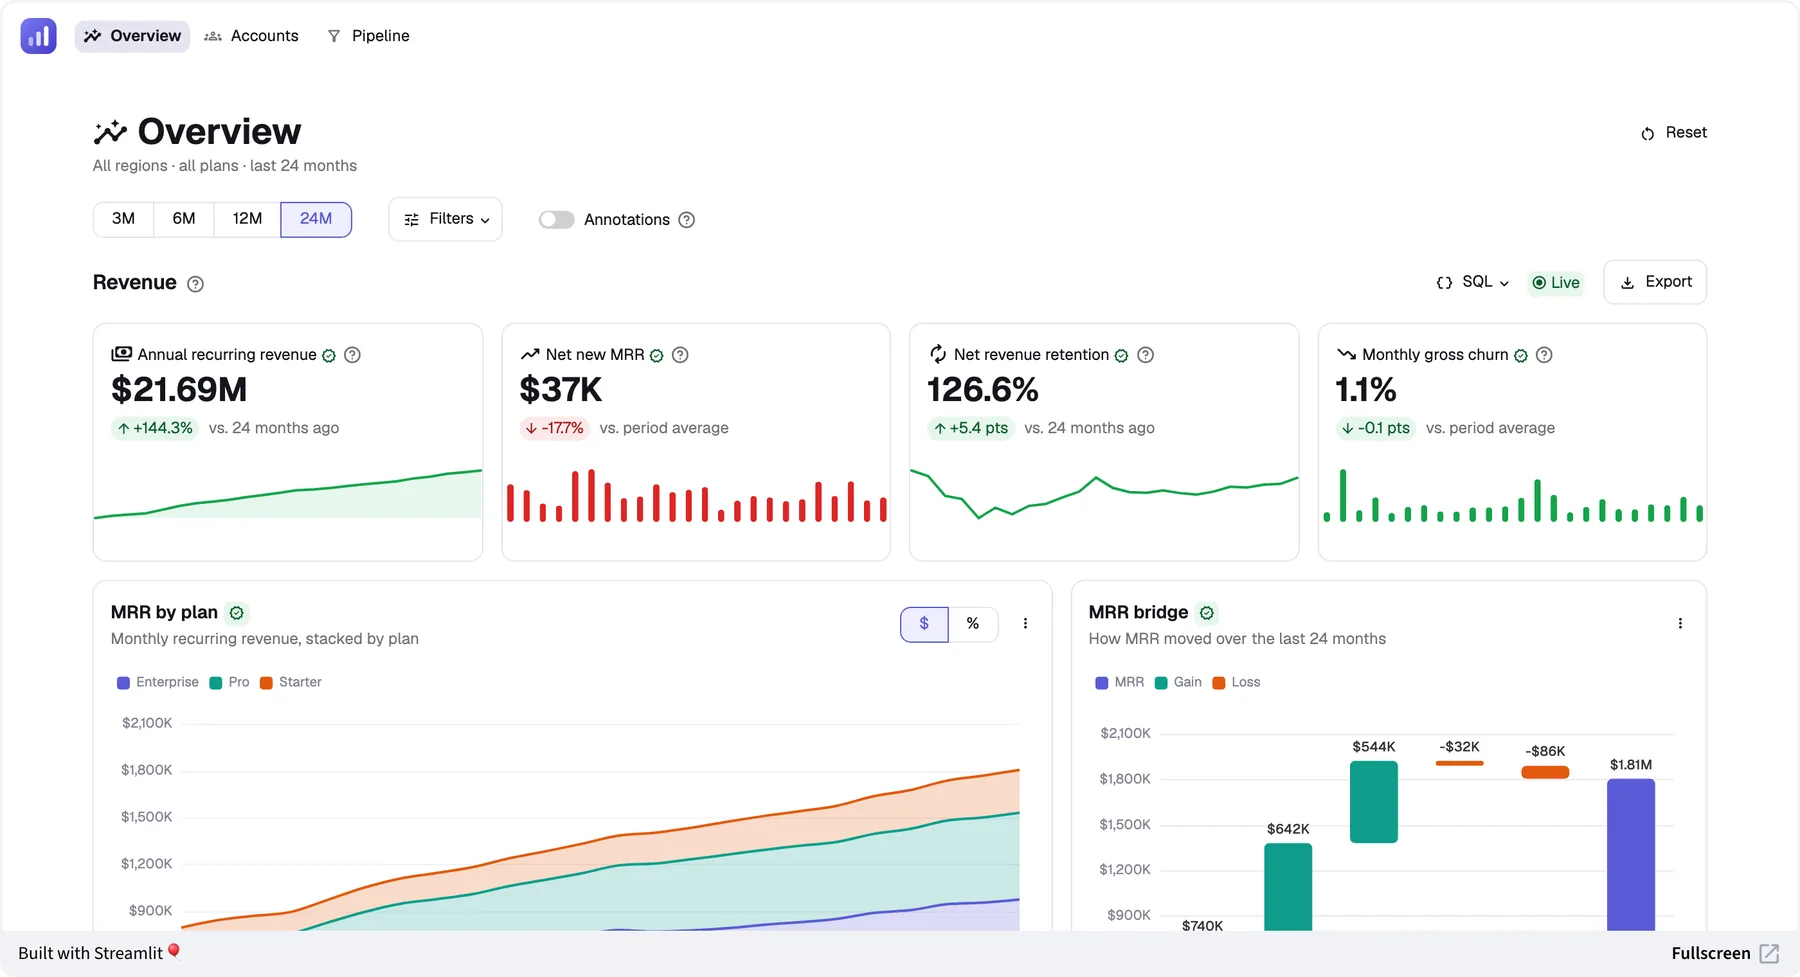
Fast, interactive dashboards over large data, with native charts for nearly every visualization, writeback where decisions happen, and an assistant that reads the same numbers. Built with agents, in Python your data team can read.
advanced-dashboard-demo.streamlit.appOpen app ↗
Made for data
Your dataframes, straight to the screen
It's the most basic reason to pick Streamlit. It starts from the data, so most dashboards need no glue code between the query and the chart. No serializing for an API, and no wiring a data grid to a charting library by hand.
Your dataframes, as they are
Hand a pandas, Polars, PyArrow, Snowpark, PySpark, DuckDB, Dask, or Modin dataframe straight to a table or a chart. NumPy arrays, database cursors, and plain lists and dicts work too.Edits come back as data
Editable tables return the edited data, ready to validate and write back.The whole Python data stack
Query, model, and forecast with any library, in the same code that draws the screen.
app.py
import polars as pl
import streamlit as st

orders = pl.read_parquet("orders.parquet")

# Any dataframe goes straight in: pandas, Polars,
# Snowpark, PySpark, DuckDB, and more
st.dataframe(orders)
st.bar_chart(orders, x="month", y="revenue")

# Edits come back as data, ready to write back
edited = st.data_editor(orders.head(20))
Built for advanced dashboards
Dashboards people trust, built on logic your team can read
Every release makes Streamlit faster and more capable for demanding dashboards. These features are hard to rebuild correctly in each app, so Streamlit solves them once in the framework, and every dashboard gets them for free, including access for agents.
Large data
Tables load rows as people scroll. Charts receive data in an efficient columnar format. Heavy parts of the page load only when needed.Fast to load
Page sections load in parallel. Cached data refreshes in the background, so nobody waits on a stale query. Caching works with async functions too, and loading skeletons show the layout right away.Fast to use
Only the section that changed reruns, and one section can refresh another. Inputs can skip reruns until people apply their choices, so heavy queries run once.Rich interactions
Select points on a chart, or rows in a table, to cross-filter and drill down. Filters, tabs, and sections live in the URL, so every view can be shared.Visualization
Native charts for nearly every visualization: KPIs with sparklines, standard and statistical charts, maps and 3D geospatial layers, diagrams, and charts inside tables. ECharts is recommended, with Altair, Plotly, and the wider Python ecosystem supported. Charts switch to faster rendering on their own as data grows.Layout
Responsive grids for KPI cards and panels that reflow on any screen, and flex rows for filter bars and toolbars that wrap or scroll. Dialogs and side drawers, menus, and pagination are built in.
Agent access
Ask your dashboard why the numbers moved
Every dashboard is also a tool for agents, with no code changes. An agent sets the dashboard's own filters and reads the KPIs, tables, and charts back as data. It runs through the same caches and partial reruns, so it gets the same numbers people see, often without a new query.
Your AI assistantrevenue dashboard · MCP
- YouWhy did net revenue in EMEA drop last week?
- Set Region to “EMEA” and read 4 metrics and the revenue table as data
- Set Week to the week before and read them again
- Two delayed renewals. Net revenue fell 4.1%, and two enterprise renewals that slipped into this week explain 3 points of that. New bookings held steady. These figures come from the revenue dashboard, so they match what your team sees.
Coming from a BI tool?
Move your dashboards to Streamlit, and modernize them on the way
For the dashboards your teams rely on, a move is a modernization, not a one-to-one copy. On Snowflake they keep the governed data, metrics, access controls, and live data your teams rely on. They also gain what BI tools weren't built for: your own Python models and logic, AI, writeback through that logic, and access for agents.
At Open Insurance, two engineers moved 30 dashboards to Streamlit in one month, remodeling the data to consistent definitions on the way. The team now spends half as much time creating dashboards as in its previous custom environment.
Rebuild the dashboards that matter
Have your coding agent rebuild them on the same governed data and metrics, such as Snowflake semantic views where you use them.Check the numbers against the original
Compare every figure with the original before anyone switches, and keep those checks as tests.Add what BI couldn't hold
Your Python models and logic, AI, writeback through that logic, and access for agents, in the same app as the numbers.Retire the reports nobody opens
Switch people over once they've signed off, and leave one-off questions to chat.
Compared to BI tools
Dashboards that compute and act, built with agents, in Python your team can read
Move your dashboards to Streamlit, and they come out better than the original. Together with Snowflake, Streamlit covers much of what teams use a BI tool for: governed data and metrics, including semantic views where you use them, Snowflake's access controls, interactive filtering and drill-down, live refresh, and sharing and embedding. On top of that, it adds what BI tools weren't built for.
| A BI tool | Streamlit | |
|---|---|---|
| What a dashboard is | A BI toolA report in a tool-specific format | StreamlitPython code in your repository |
| Logic | A BI toolA formula or modeling language | StreamlitYour existing Python models, libraries, and tests, plus SQL and the whole Python ecosystem for forecasts and AI |
| Charts | A BI toolThe vendor's chart catalog and custom visuals | StreamlitNative charts, maps, and diagrams, plus any Python library |
| Interactivity | A BI toolBuilt into the tool | StreamlitLazy-loading tables, cross-filtering, drill-down, background refresh, and shareable views, from Python that agents write and change |
| Taking action | A BI toolBuilt mainly for reading, with writeback in some tools | StreamlitEditable tables, forms, approvals, and writeback, validated by the same Python code that produced the numbers |
| Who builds it | A BI toolAnalysts in a visual editor | StreamlitAnyone, through a coding agent, reviewed by the data team |
| Change management | A BI toolMostly published from a visual editor | StreamlitPull requests, review, and tests, with agents making changes from a request in plain words |
| Questions from agents | A BI toolThrough the vendor's own assistant or connectors | StreamlitAn assistant sets the filters and reads the numbers through the dashboard's own logic, instead of guessing at the warehouse schema |
| Cost | A BI toolPer-seat licenses | StreamlitOpen source; pay for the compute you use |
| Best for | A BI toolDrag-and-drop self-service and paginated reports | StreamlitThe dashboards that matter most, with logic and actions |
A BI tool still fits
- Drag-and-drop self-service exploration by people who don't want code
- Pixel-precise paginated reports
From BI concepts to Streamlit
What each part of a dashboard becomes
Use this as a checklist when you, or your coding agent, rebuild a dashboard. It maps concepts, not files: there's no automatic converter, and the point is to rebuild what matters, not to copy everything.
| In a BI tool | In Streamlit |
|---|---|
| Slicers and filters | In StreamlitSelect boxes, multiselects, date inputs, and sliders, bound to the URL so filtered views can be shared (bind="query-params") |
| Measures and calculated fields | In StreamlitPlain Python or SQL functions, cached with @st.cache_data |
| Scheduled refresh | In StreamlitCached queries that expire after a set time and refresh in the background (ttl, refresh_mode="background") |
| KPI cards | In StreamlitMetrics with deltas and sparklines (st.metric, chart_data) |
| Visuals | In StreamlitNative charts for nearly every visualization, from quick charts to ECharts, Altair, and Plotly, maps and 3D layers, and diagrams (st.echarts_chart, st.altair_chart, st.pydeck_chart) |
| Tables and matrices | In StreamlitTables with number formats, progress bars, and links that load rows as people scroll (st.dataframe, column_config) |
| Cross-filtering and drill-down | In StreamlitSelections on charts and tables drive the rest of the page (on_select="rerun") |
| Report pages | In StreamlitMultipage apps with shareable page URLs (st.navigation) |
| Auto-refreshing visuals | In StreamlitSections that rerun on their own schedule (@st.fragment(run_every=...)) |
| Data entry and approvals | In StreamlitEditable tables and forms that write back to your database (st.data_editor, st.form) |
| Themes and templates | In StreamlitOne brand theme for every app, with colors, fonts, and chart palettes ([theme] base) |
| Viewer access | In StreamlitBuilt-in authentication (st.login) on top of your existing access controls; on Snowflake, queries can run with caller's rights, so each viewer sees only the data they may see |
| Natural-language questions | In StreamlitEvery dashboard is also a tool that assistants call over MCP, with the dashboard's own logic and access rules |
| Version history | In StreamlitGit, so every change is a reviewable diff |
Compared to dashboards built in chat
A chat report is a snapshot. An app is what your team relies on.
Most dashboards generated in chat are one-off reports: a page that renders in the browser, with the data from one conversation baked in. You can share it, but it doesn't refresh, nobody answers for its logic, it isn't tested, and it can't take action. Ask the question in chat. When the answer needs to become something more, it becomes a Streamlit app.
It needs to stay live
Fresh data every time someone opens it.It takes new parameters
Filters, levers, and drill-downs instead of a fixed answer.It needs to be reviewed and tested
Reviewed code in your repository, with tests that run in CI.It writes decisions back
Approvals, sign-offs, and corrections, saved where the data lives.
Frequently asked questions
Get started
Rebuild the dashboard that matters most
Set up your coding agent with Streamlit's skills, point it at your data, and describe the dashboard. Then check the numbers against the original.
Terminal
$ pip install streamlit
$ streamlit skills

> /developing-with-streamlit Rebuild our
> weekly revenue dashboard on the sales.revenue
> semantic view, with region and plan filters,
> and a check against last week's numbers.